The most common way to analyze and present Prometheus data is with a Grafana dashboard. This article explains how to configure Azure Monitor managed service for Prometheus as a data source for different versions of Grafana including Azure Managed Grafana, self-hosted Grafana running on an Azure VM, and a Grafana instance running outside Azure.
Important
Azure Monitor dashboards with Grafana is now in public preview. This version of Grafana is hosted in Azure and requires no configuration to connect to Azure Monitor managed service for Prometheus. This article describes how to connect to an Azure Monitor workspace to include Prometheus metrics in other versions of Grafana that do require configuration.
Azure Monitor workspace query endpoint
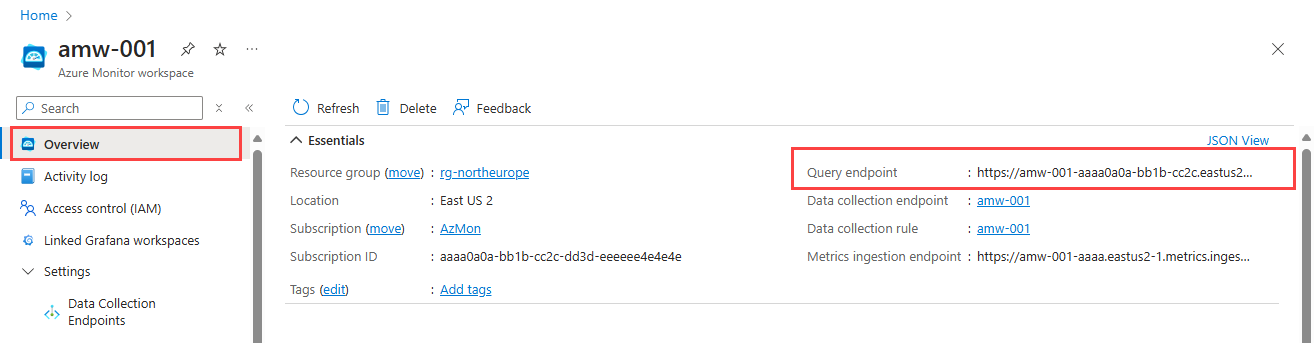
Azure Monitor managed service for Prometheus stores data in an Azure Monitor workspace. Each version of Grafana uses the query endpoint for this workspace to access it. To find the query endpoint, open the Overview page for your Azure Monitor workspace in the Azure portal.
Starting with Grafana 13, Azure authentication for Prometheus is available only through the Azure Monitor Managed Service for Prometheus data source plugin, not the core (open-source) Prometheus data source. In Grafana 11 and 12, the core Prometheus data source also supports Azure authentication. On Grafana 13 and later, use the Azure Monitor Managed Service for Prometheus plugin to connect to an Azure Monitor workspace. For background, see Prometheus data source update: Redefining our big tent philosophy. For migration details, see Azure authentication for the Prometheus data source.
Note
Existing Azure-authenticated Prometheus data sources migrate to the plugin automatically, so your dashboards, alerts, and queries keep working. Data sources that use non-Azure authentication are unaffected.
An Azure Managed Grafana instance is automatically configured with a managed identity with the Monitoring Data Reader role required to allow the identity to read any monitoring data for the subscription. The identity is used to authenticate Grafana to Azure Monitor.
For more information about the data source plugins that Azure Managed Grafana supports, see Manage data source plugins for Azure Managed Grafana.
Create the Prometheus data source in Grafana
Use the following steps to configure Prometheus as a data source:
Open your Azure Managed Grafana workspace in the Azure portal and select the endpoint to view the Grafana workspace.
Select Connections > Data sources and then Add data source.
Search for and select the Prometheus data source. On Grafana 13 and later, select Azure Monitor Managed Service for Prometheus. On Grafana 11 and 12, select Prometheus.
Paste the query endpoint from your Azure Monitor workspace into the Prometheus server URL field.
Under Authentication, select Azure Auth.
Under Azure Authentication, select Managed Identity from the Authentication dropdown list.
Scroll to the bottom of the page and select Save & test.

Use the following steps to configure self-managed Grafana on an Azure VM to use Azure-hosted Prometheus data. For this configuration, you must enable a system-assigned managed identity for the VM.
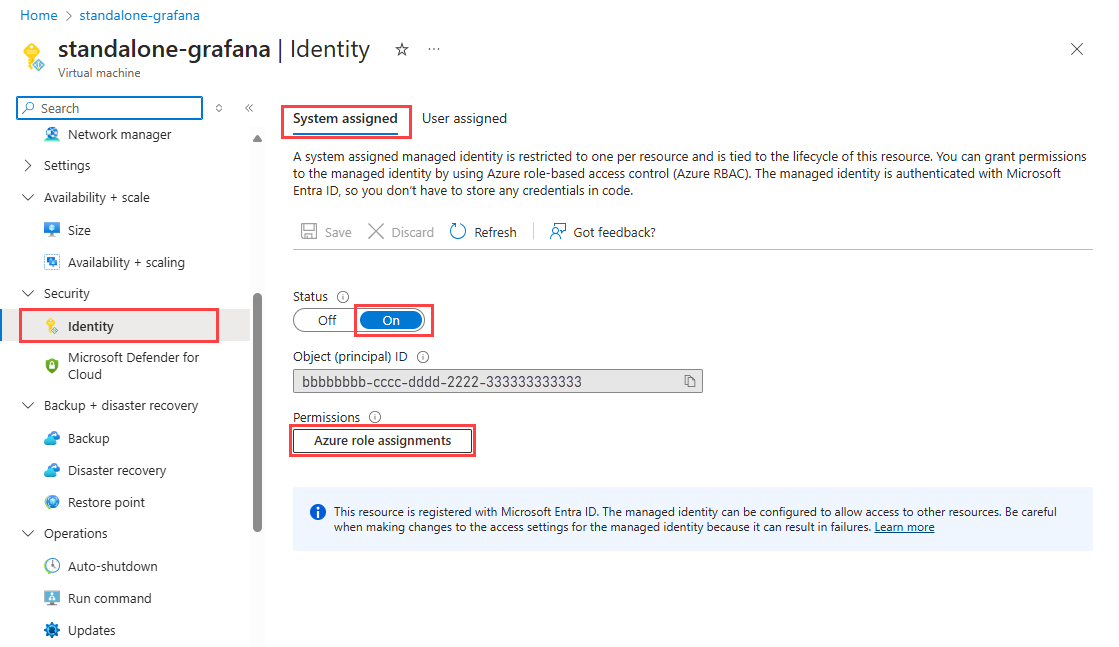
Open the Identity page for your VM in the Azure portal and set the Status to On.
Select Save.
Select Azure role assignments to review the existing access in your subscription.
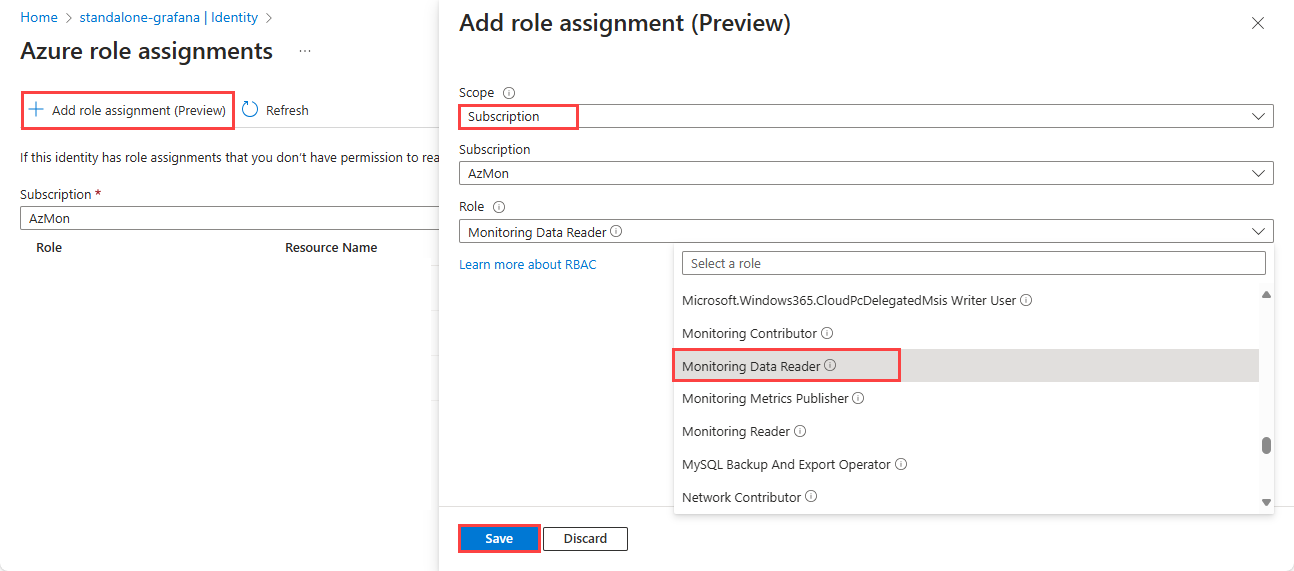
If the Monitoring Data Reader role isn't listed for your subscription or resource group, select + Add role assignment.
In the Scope dropdown list, select either Subscription or Resource group. Selecting Subscription allows access to all Azure Monitor workspaces in the subscription. Selecting Resource group allows access only to Azure Monitor workspaces in the selected resource group.
Select the specific subscription or resource group where your Azure Monitor workspace is located.
From the Role dropdown list, select Monitoring Data Reader and then select Save.
Versions 9.x and greater of Grafana support Azure Authentication, but it isn't enabled by default. To enable Azure Authentication, update your Grafana configuration and restart the Grafana instance. To find your grafana.ini file, review the Configure Grafana document from Grafana Labs.
Use the following steps to enable Azure Authentication:
- Locate and open the
grafana.ini file on your VM.
- Under the
[auth] section of the configuration file, change the azure_auth_enabled setting to true.
- Under the
[azure] section of the configuration file, change the managed_identity_enabled setting to true
- Restart the Grafana instance.
Create the Prometheus data source in Grafana
Use the following steps to configure Prometheus as a data source:
Open Grafana in your browser and select Connections > Data sources.
Select Add data source.
Search for and select the Prometheus data source. On Grafana 13 and later, select Azure Monitor Managed Service for Prometheus. On Grafana 11 and 12, select Prometheus.
Paste the query endpoint from your Azure Monitor workspace into the Prometheus server URL field.
Under Authentication, select Azure Auth.
Under Azure Authentication, select Managed Identity from the Authentication dropdown list.
Scroll to the bottom of the page and select Save & test.
If your Grafana instance isn't hosted in Azure, then use Microsoft Entra ID to connect to your Azure Monitor workspace.
Use the following steps to set up Microsoft Entra ID authentication:
Register an app with Microsoft Entra ID
Open the Active Directory Overview page in the Azure portal and select App registration.
On the Register an application page, enter a name for the application and select Register.
Note the Application (client) ID value and Directory (tenant) ID value. They're used in the Grafana authentication settings.
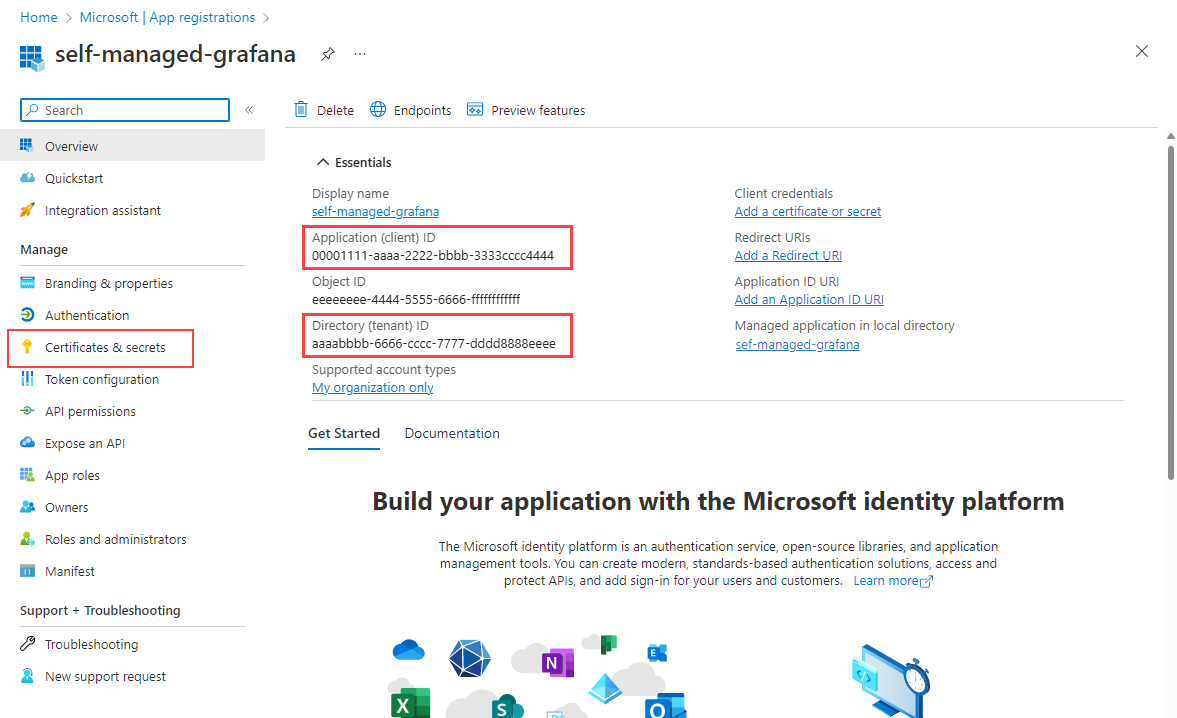
On the app's overview page, select Certificates and Secrets.
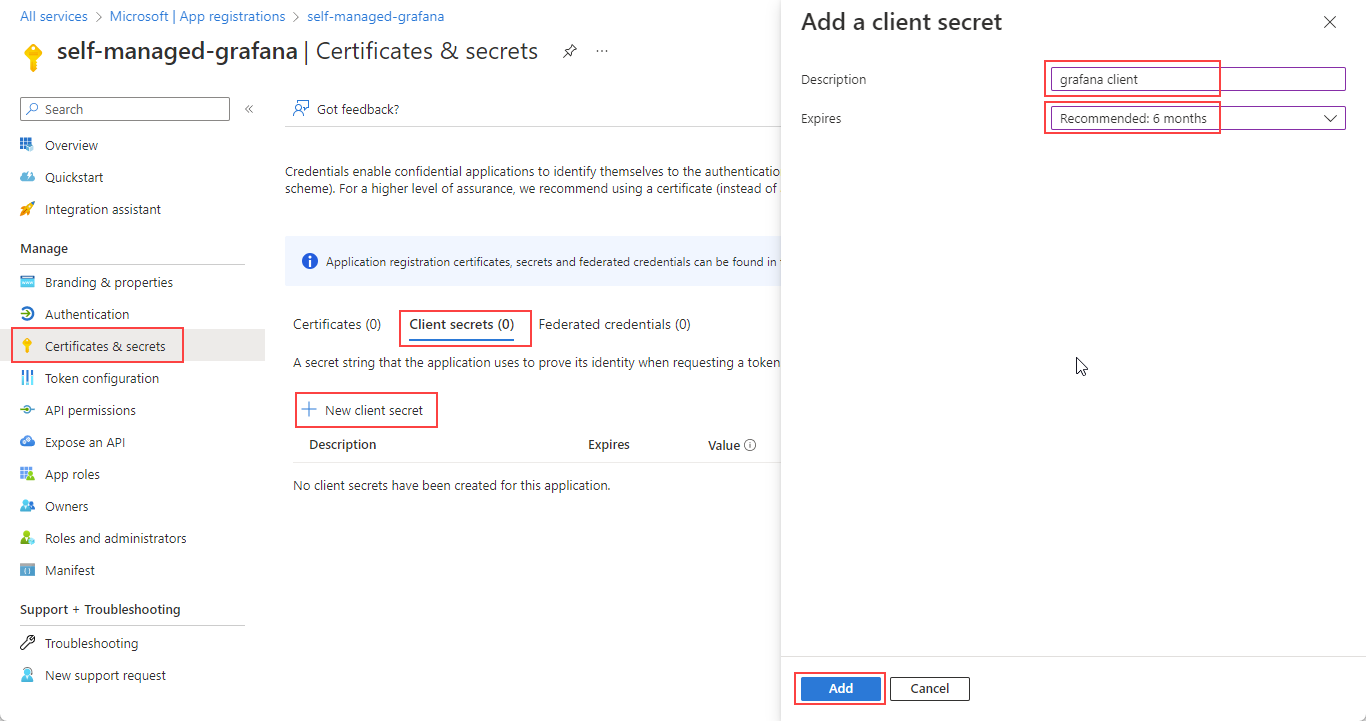
On the Client secrets tab, select New client secret.
Enter a description.
Select an expiration period from the dropdown list, and then select Add.
Note
Create a process to renew the secret and update your Grafana data source settings before the secret expires. After the secret expires, Grafana loses the ability to query data from your Azure Monitor workspace.
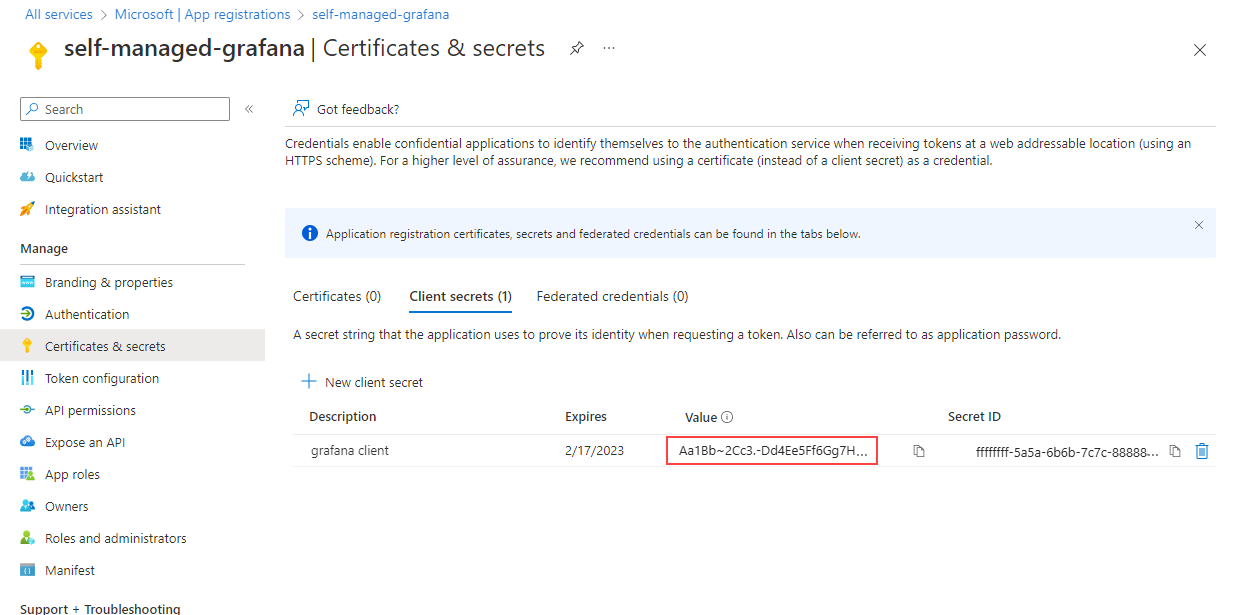
Copy and save the client secret value.
Note
You can view client secret values only immediately after creation. Save the secret before you leave the page.
Allow your app access to your workspace
Open your Azure Monitor workspace in the Azure portal and select Access control (IAM).
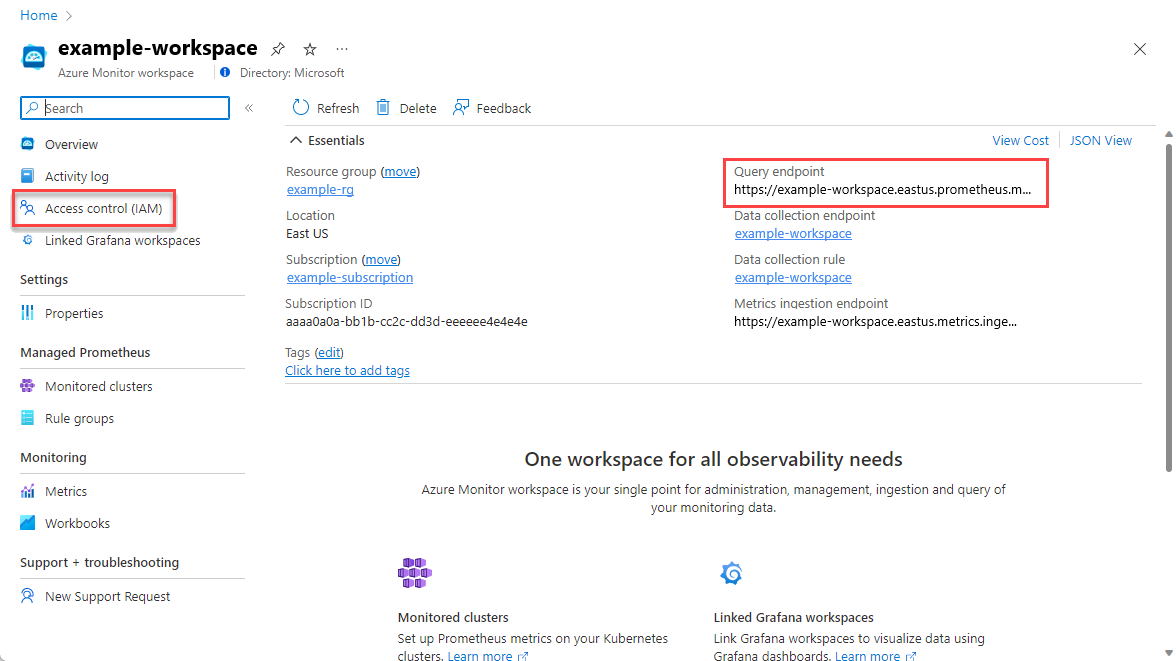
Select Add > Add role assignment.
On the Add role assignment page, search for Monitoring.
Select Monitoring data reader, and then select the Members tab.
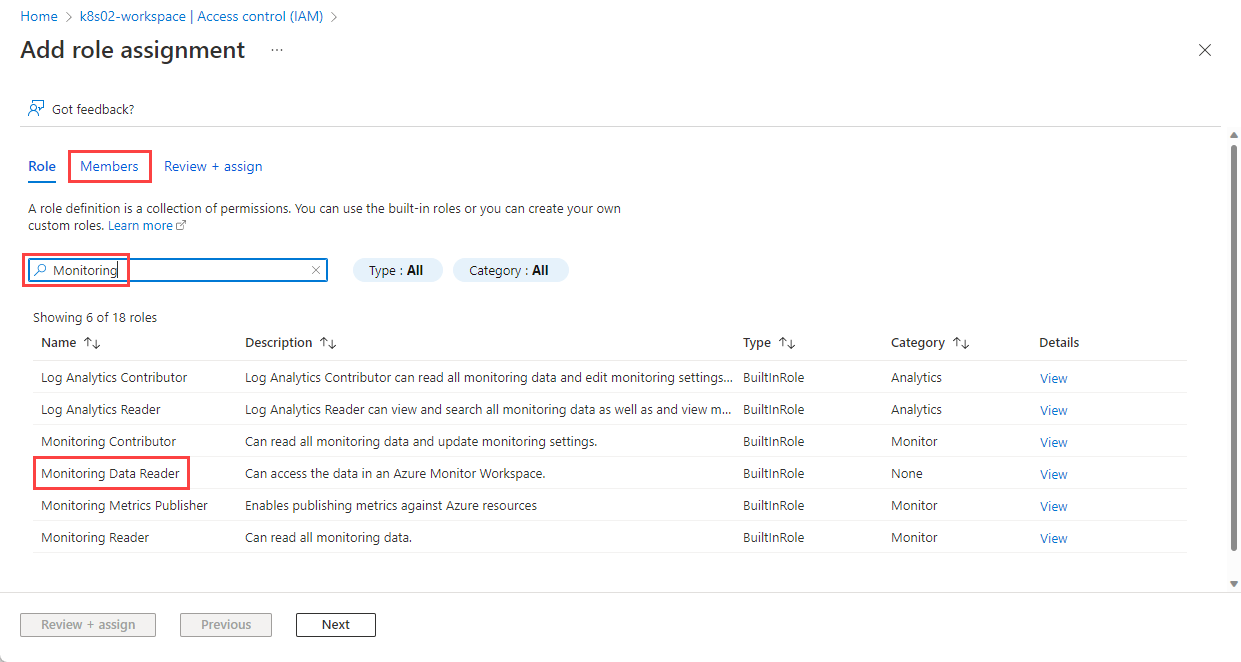
Choose Select members. Search for the app that you registered in the Register an app with Microsoft Entra ID section and select it.
Select Review + assign.
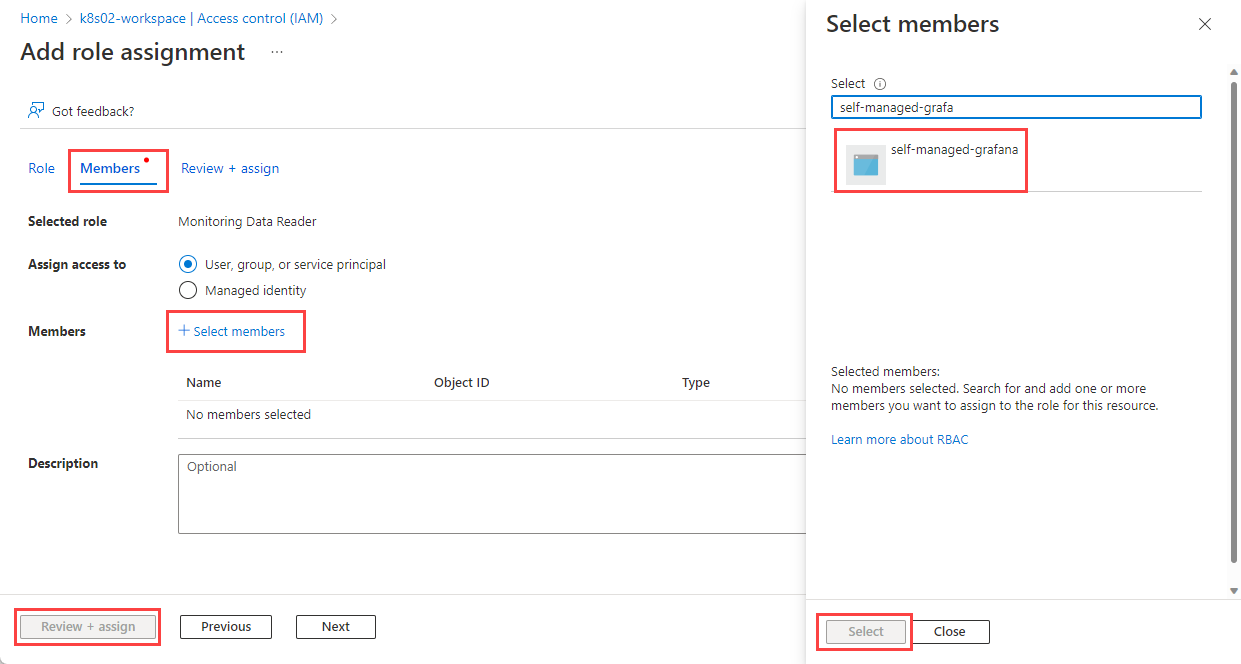
You created your app registration and assigned it access to query data from your Azure Monitor workspace. The next step is to set up your Prometheus data source in Grafana.
Grafana now supports connecting to Azure Monitor managed Prometheus by using the Prometheus data source. For self-hosted Grafana instances, a configuration change is needed to use the Azure Authentication option in Grafana. For Grafana instances that Azure doesn't manage, make the following changes.
Versions 9.x and greater of Grafana support Azure Authentication, but it isn't enabled by default. To enable Azure Authentication, update your Grafana configuration and restart the Grafana instance. To find your grafana.ini file, review the Configure Grafana document from Grafana Labs.
- Locate and open the
grafana.ini file on your VM.
- Identify your Grafana version.
- For Grafana 9.0, in the
[feature_toggles] section, set prometheus_azure_auth to true.
- For Grafana 9.1 and later versions, in the
[auth] section, set the azure_auth_enabled setting to true.
- Restart the Grafana instance.
Create the Prometheus data source in Grafana
Open Grafana in your browser.
Select Connections > Data sources and then select Add data source.
Search for and select the Prometheus data source. On Grafana 13 and later, select Azure Monitor Managed Service for Prometheus. On Grafana 11 and 12, select Prometheus.
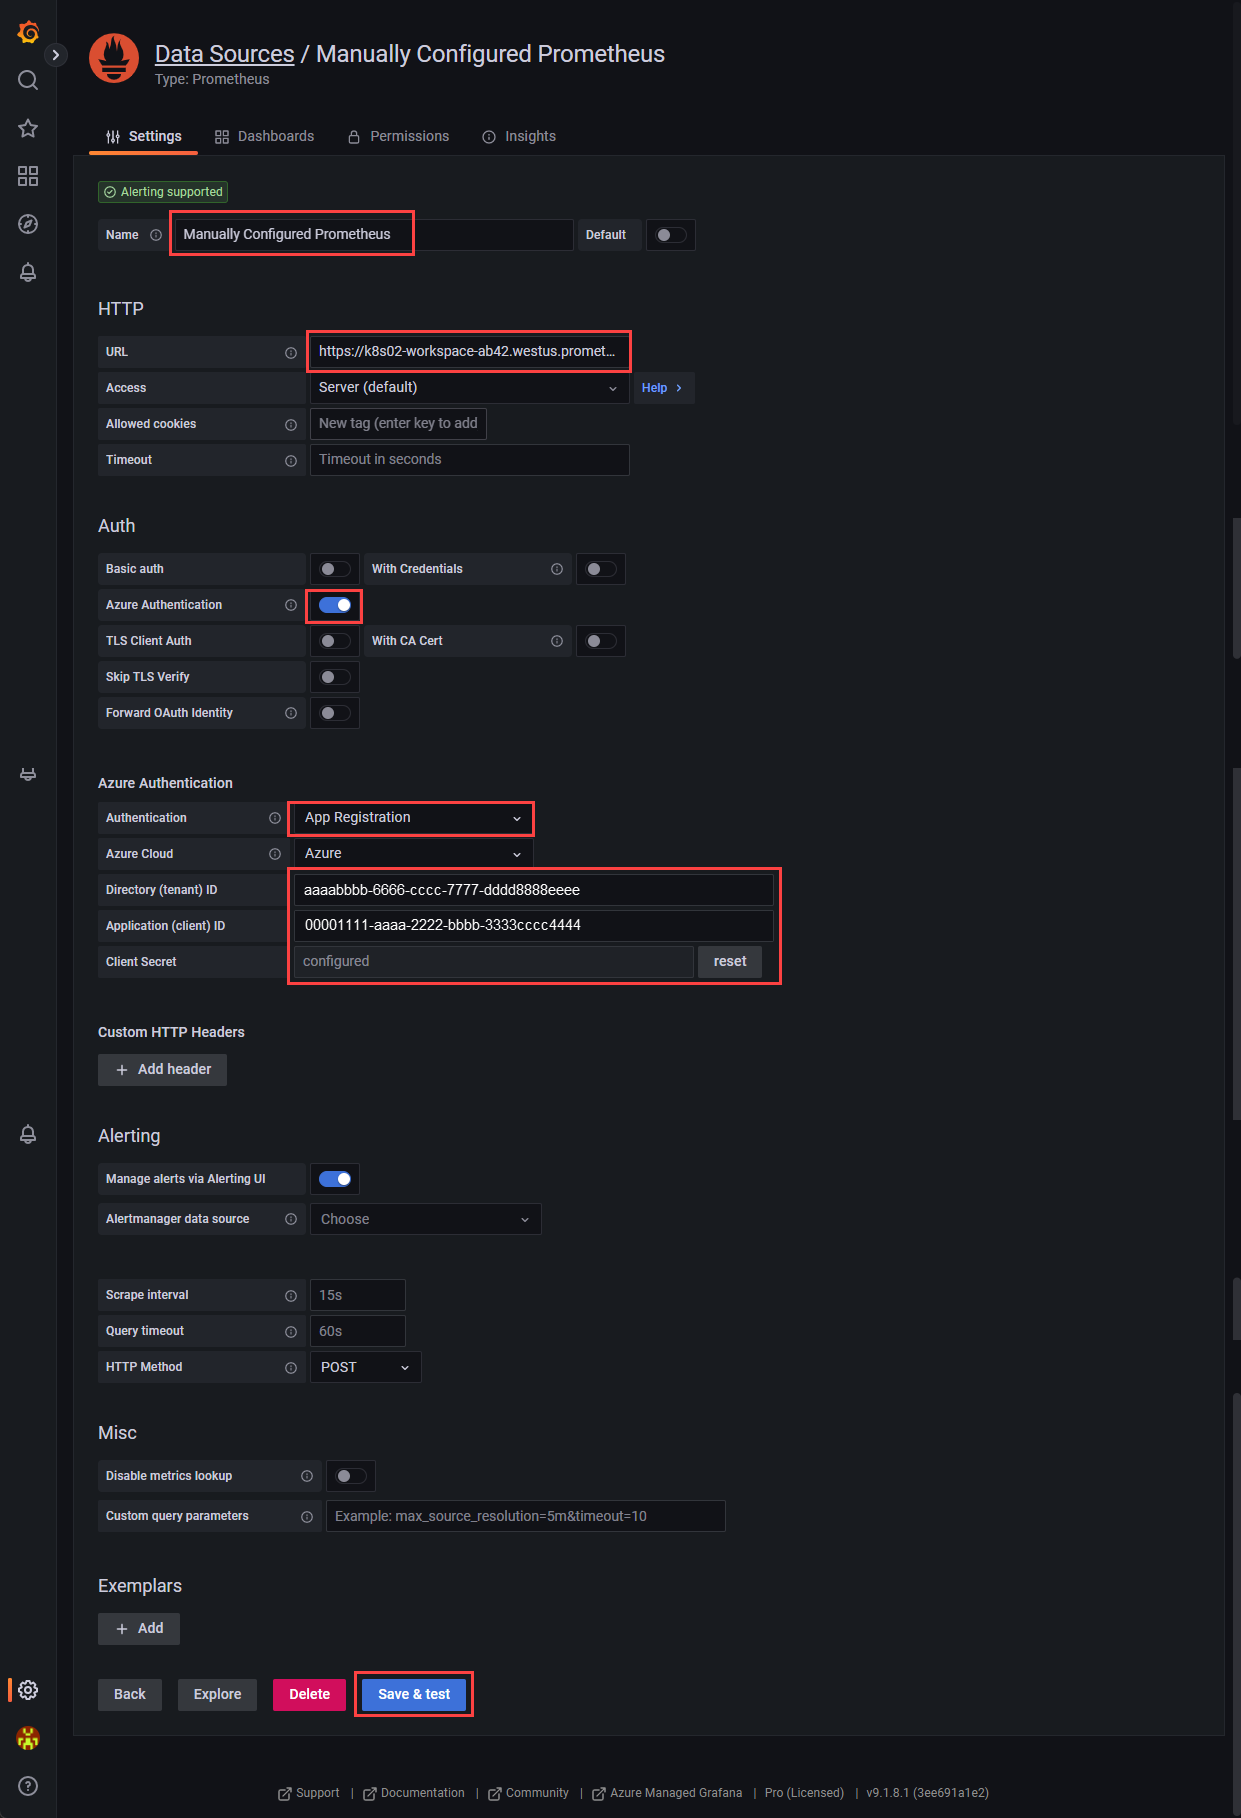
Paste the query endpoint from your Azure Monitor workspace into the URL field.
Under Authentication, select Azure Auth. For earlier Grafana versions, under Auth, turn on Azure Authentication.
Under Azure Authentication, select App Registration from the Authentication dropdown list.
Enter the Direct (tenant) ID value, the Application (client) ID value, and the Client Secret value that were generated when you created your app registration.
Scroll to the bottom of the page and select Save & test.
Related content

