Note
Access to this page requires authorization. You can try signing in or changing directories.
Access to this page requires authorization. You can try changing directories.
Monitoring provides insights into the behavior and health of your systems. It helps you get a holistic view of the environment and historic trends, correlate diverse factors, and measure changes in performance, consumption, or error rate.
Azure Functions provides built-in integration with Application Insights. From Application Insights, you can get information like the number of function app instances or requests and the dependency telemetry of a function. When you use Functions together with Azure Event Hubs, Application Insights can also track the outgoing dependency telemetries to the event hub, calculate the processing time, and show the end-to-end flow of the system that's connected via Event Hubs.
This article introduces useful features and insights that you can get from Application Insights for your solution that uses Event Hubs together with Functions.
Application map
Application map shows how the components in a system interact with each other. Because Application Insights provides dependency telemetry, it can map the flow of events between Azure Functions and Event Hubs, including the average number of calls for each function and the average duration of an event in Event Hubs. It also displays transactions that contain failures in red.
After you send the expected load to your system, you can go to Application Insights in the Azure portal and select Application map in the navigation pane. The following map shows three functions, three event hubs, and apparent failures during writes to a downstream database.

End-to-end transaction details
End-to-end transaction details show how your system components interact with each other, in chronological order. This view also shows how long an event took to process. You can drill into the telemetry of each component in this view. Doing so helps you troubleshoot across components within the same request when a problem occurs.

Platform metrics and telemetry
You can use platform-generated metrics in Azure Monitor for Event Hubs and Azure Functions to monitor a solution's behavior and health:
Event Hubs metrics in Azure Monitor can help you capture useful insights for Event Hubs. Insights include aggregates of Incoming Requests, Outgoing Requests, Throttled Requests, Successful Requests, Incoming Messages, Outgoing Messages, Captured Messages, Incoming Bytes, Outgoing Bytes, Captured Bytes, and User Errors.
Azure Functions provides many of the same metrics as Azure App Service. It also provides Function Execution Count and Function Execution Units metrics that you can use to understand the utilization and cost of the Consumption plan. Other useful metrics include Connections, Data In, Data Out, Average Memory Working Set, Thread Count, Requests, and Response Time.
Azure Functions integrates with Application Insights to provide advanced and detailed telemetry and insights into the Functions host and function executions. To learn more, see Analyze Azure Functions telemetry in Application Insights. When you use Application Insights to monitor a topology, a variety of configurations is available. To learn more, see Configure monitoring for Azure Functions.
The following example shows extra telemetry for functions triggered by Event Hubs. It's generated in the traces table:
Trigger Details: PartitionId: 6, Offset: 3985758552064-3985758624640, EnqueueTimeUtc: 2025-10-31T12:51:58.1750000+00:00-2025-10-31T12:52:03.8160000+00:00, SequenceNumber: 3712266-3712275, Count: 10
This data is useful because it contains information about the message that triggered the function and can be used for querying and insights. It includes the following data for each time the function is triggered:
- The partition ID (6)
- The partition offset range (3985758552064-3985758624640)
- The enqueue time range in UTC (2025-10-31T12:51:58.1750000+00:00-2025-10-31T12:52:03.8160000+00:00)
- The sequence number range 3712266-3712275
- The count of messages (10)
See the Example Application Insights queries section of this article for examples of how to use this telemetry.
You can also use custom telemetry for different languages (C# class library, C# isolated, C# script, JavaScript, Java, PowerShell, and Python). This logging appears in the traces table in Application Insights. You can create your own entries into Application Insights and add custom dimensions that you can use for querying data and creating custom dashboards.
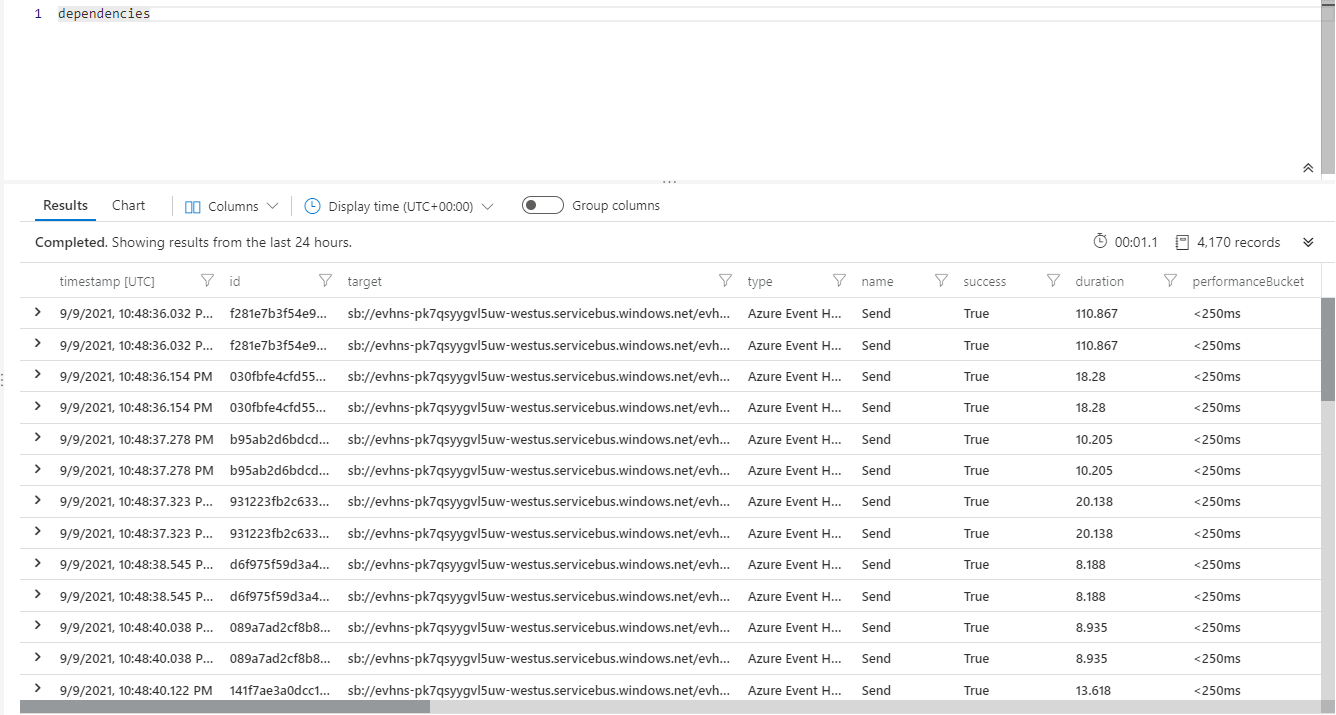
Finally, when your function app connects to an event hub by using an output binding, entries are also written to the Application Insights Dependencies table.
For Event Hubs, the correlation is injected into the event payload, and you see a Diagnostic-Id property in events:
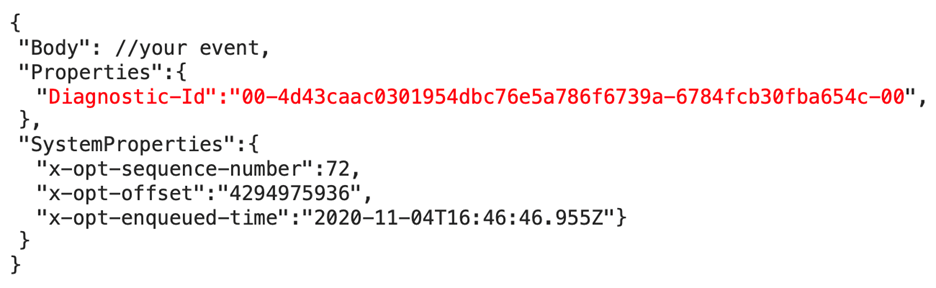
This property uses the W3C Trace Context format that's also used as Operation Id and Operation Links in telemetry created by Functions. This format allows Application Insights to construct the correlation between event hub events and function executions, even when they're distributed.

Example Application Insights queries
The following list contains Application Insights queries that can help you monitor a solution that uses Event Hubs together with Azure Functions. These queries display detailed information for functions triggered by event hubs that use telemetry emitted by the Event Hubs extension.
When sampling is enabled in Application Insights, there might be gaps in the data.
Detailed event processing information
The data is only emitted in the correct format when batched dispatch is used. When you use batch dispatch, the function accepts multiple events for each execution. We recommend this mode for improved performance. Keep in mind the following considerations:
- The
dispatchTimeMillisecondsvalue approximates the length of time between when the event was written to the event hub and when it was picked up by the function app for processing. dispatchTimeMillisecondscan be negative or otherwise inaccurate because of clock drift between the event hub server and the function app.- Event Hubs partitions are processed sequentially. A message isn't dispatched to function code for processing until all previous messages are processed. Monitor the execution time of your functions because longer execution times cause dispatch delays.
- The calculation uses the enqueueTime of the first message in the batch. Dispatch times might be lower for other messages in the batch.
dispatchTimeMillisecondsis based on the point in time.- Sequence numbers are per-partition, and duplicate processing can occur because Event Hubs doesn't guarantee exactly-once message delivery.
traces
| where message startswith "Trigger Details: Parti"
| parse message with * "tionId: " partitionId:string ", Offset: "
offsetStart:string "-" offsetEnd:string", EnqueueTimeUtc: "
enqueueTimeStart:datetime "+00:00-" enqueueTimeEnd:datetime "+00:00, SequenceNumber: "
sequenceNumberStart:string "-" sequenceNumberEnd:string ", Count: "
messageCount:int
| extend dispatchTimeMilliseconds = (timestamp - enqueueTimeStart) / 1ms
| project timestamp, cloud_RoleInstance, operation_Name, processId =
customDimensions.ProcessId, partitionId, messageCount, sequenceNumberStart,
sequenceNumberEnd, enqueueTimeStart, enqueueTimeEnd, dispatchTimeMilliseconds
The following screenshot shows the query results.
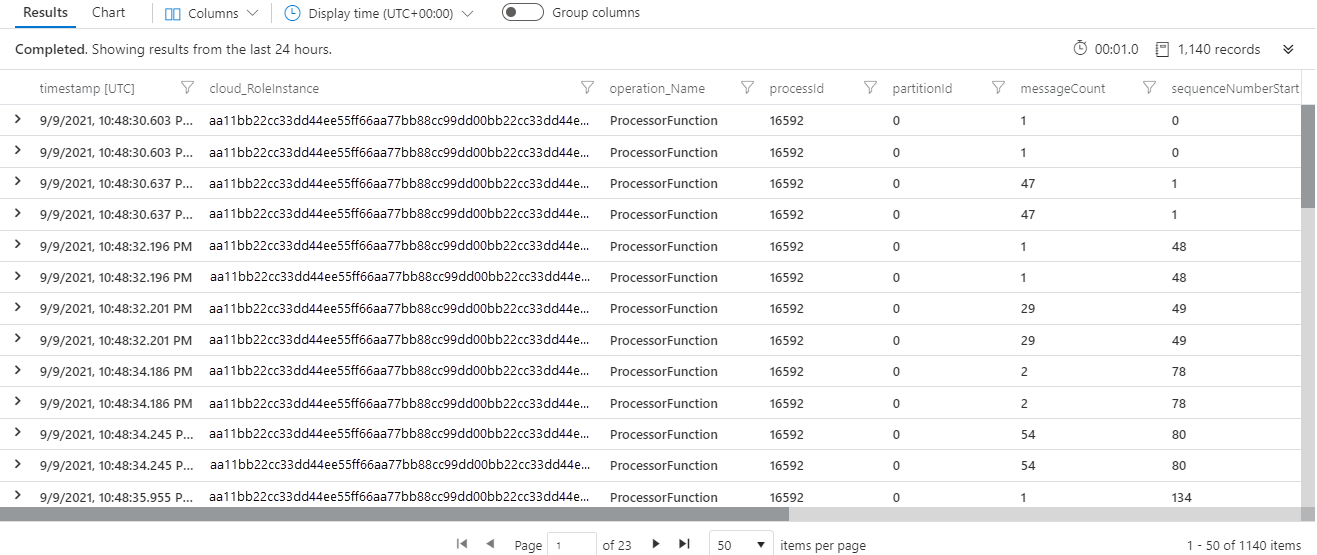
Dispatch latency visualization
This query visualizes the 50th and 90th percentile event dispatch latency for a given function that's triggered by an event hub. For more information and notes, see the previous query.
traces
| where operation_Name == "<enter the name of your function here>"
| where message startswith "Trigger Details: Parti"
| parse message with * "tionId: " partitionId:string ", Offset: "
offsetStart:string "-" offsetEnd:string", EnqueueTimeUtc: "
enqueueTimeStart:datetime "+00:00-" enqueueTimeEnd:datetime "+00:00, SequenceNumber: "
sequenceNumberStart:string "-" sequenceNumberEnd:string ", Count: "
messageCount:int
| extend dispatchTimeMilliseconds = (timestamp - enqueueTimeStart) / 1ms
| summarize percentiles(dispatchTimeMilliseconds, 50, 90) by bin(timestamp, 5m)
| render timechart
The following screenshot shows the query results.

Dispatch latency summary
This query is similar to the previous one, but it shows a summary view.
traces
| where message startswith "Trigger Details: Parti"
| parse message with * "tionId: " partitionId:string ", Offset: "
offsetStart:string "-" offsetEnd:string", EnqueueTimeUtc: "
enqueueTimeStart:datetime "+00:00-" enqueueTimeEnd:datetime "+00:00, SequenceNumber: "
sequenceNumberStart:string "-" sequenceNumberEnd:string ", Count: "
messageCount:int
| extend dispatchTimeMilliseconds = (timestamp - enqueueTimeStart) / 1ms
| summarize messageCount = sum(messageCount),
percentiles(dispatchTimeMilliseconds, 50, 90, 99, 99.9, 99.99) by operation_Name
The following screenshot shows the query results.

Message distribution across partitions
This query shows how to visualize message distribution across partitions.
traces
| where message startswith "Trigger Details: Parti"
| parse message with * "tionId: " partitionId:string ", Offset: "
offsetStart:string "-" offsetEnd:string", EnqueueTimeUtc: "
enqueueTimeStart:datetime "+00:00-" enqueueTimeEnd:datetime "+00:00, SequenceNumber: "
sequenceNumberStart:string "-" sequenceNumberEnd:string ", Count: "
messageCount:int
| summarize messageCount = sum(messageCount) by cloud_RoleInstance,
bin(timestamp, 5m)
| render areachart kind=stacked
The following screenshot shows the query results.

Message distribution across instances
This query shows how to visualize message distribution across instances.
traces
| where message startswith "Trigger Details: Parti"
| parse message with * "tionId: " partitionId:string ", Offset: "
offsetStart:string "-" offsetEnd:string", EnqueueTimeUtc: "
enqueueTimeStart:datetime "+00:00-" enqueueTimeEnd:datetime "+00:00, SequenceNumber: "
sequenceNumberStart:string "-" sequenceNumberEnd:string ", Count: "
messageCount:int
| summarize messageCount = sum(messageCount) by cloud_RoleInstance,
bin(timestamp, 5m)
| render areachart kind=stacked
The following screenshot shows the query results.

Executing instances and allocated instances
This query shows how to visualize the number of Azure Functions instances that are processing events from Event Hubs, and the total number of instances (processing and waiting for lease). The two numbers should usually match.
traces
| where message startswith "Trigger Details: Parti"
| summarize type = "Executing Instances", Count = dcount(cloud_RoleInstance) by
bin(timestamp, 60s)
| union (
    traces
    | summarize type = "Allocated Instances", Count = dcount(cloud_RoleInstance) by
bin(timestamp, 60s)
)
| project timestamp, type, Count
| render timechart
The following screenshot shows the query results.

All telemetry for a specific function execution
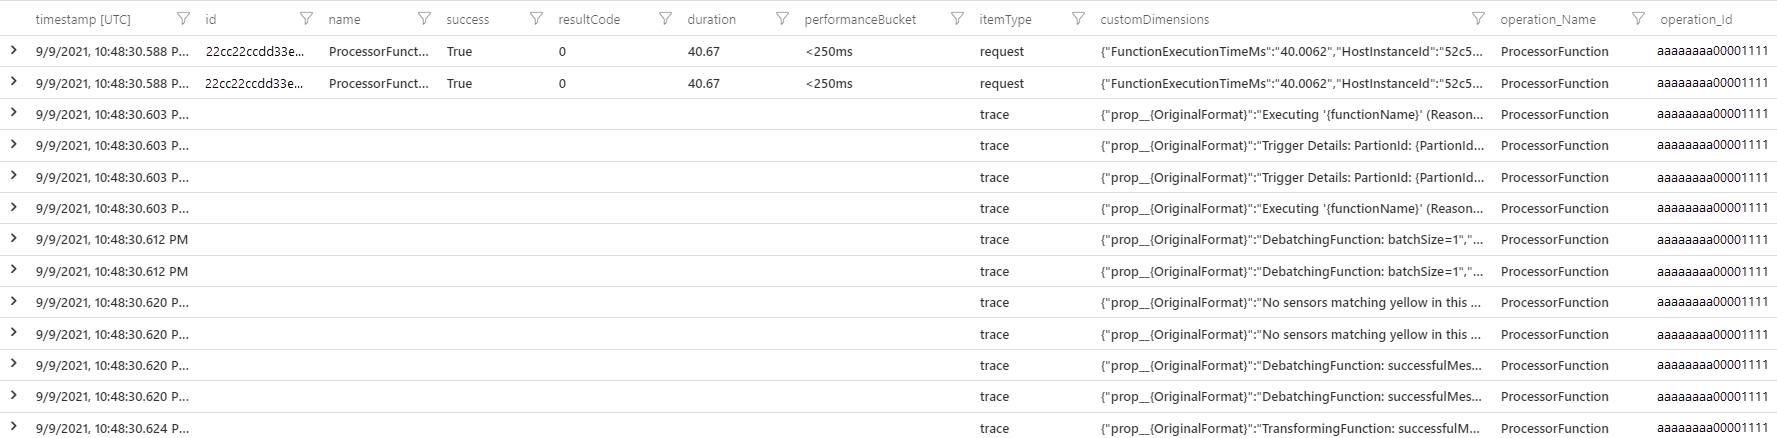
You can use the operation_Id field across the different tables in Application Insights. For Azure functions triggered by Event Hubs, the following query, for example, returns the trigger information, telemetry from logs inside the function code, and dependencies and exceptions:
union isfuzzy=true requests, exceptions, traces, dependencies
| where * has "<enter the operation_Id of your function execution here>"
| order by timestamp asc
The following screenshot shows the query results.
End-to-end latency for an event
The enqueueTimeUtc property in the trigger detail trace shows the enqueue time of only the first event of each batch that the function processed. You can use a more advanced query to calculate the end-to-end latency for events that pass through two functions connected by an event hub. This query expands the operation links (if there are any) in the second function's request and maps its completion time to the corresponding operation ID of the first function's start time.
let start = view(){
requests
| where operation_Name == "FirstFunction"
| project start_t = timestamp, first_operation_Id = operation_Id
};
let link = view(){
requests
| where operation_Name == "SecondFunction"
| mv-expand ex = parse_json(tostring(customDimensions["_MS.links"]))
| extend parent = case(isnotempty(ex.operation_Id), ex.operation_Id, operation_Id )
| project first_operation_Id = parent, second_operation_Id = operation_Id
};
let finish = view(){
traces
| where customDimensions["EventName"] == "FunctionCompleted" and operation_Name
== "SecondFunction"
| project end_t = timestamp, second_operation_Id = operation_Id
};
start
| join kind=inner (
link
| join kind=inner finish on second_operation_Id
) on first_operation_Id
| project start_t, end_t, first_operation_Id, second_operation_Id
| summarize avg(datetime_diff('second', end_t, start_t))
The following screenshot shows the query results.

Contributors
Microsoft maintains this article. The following contributors wrote this article.
Principal author:
- David Barkol | AI Apps GBB
To see nonpublic LinkedIn profiles, sign in to LinkedIn.